// Cost × Evidence
Price is not proof.
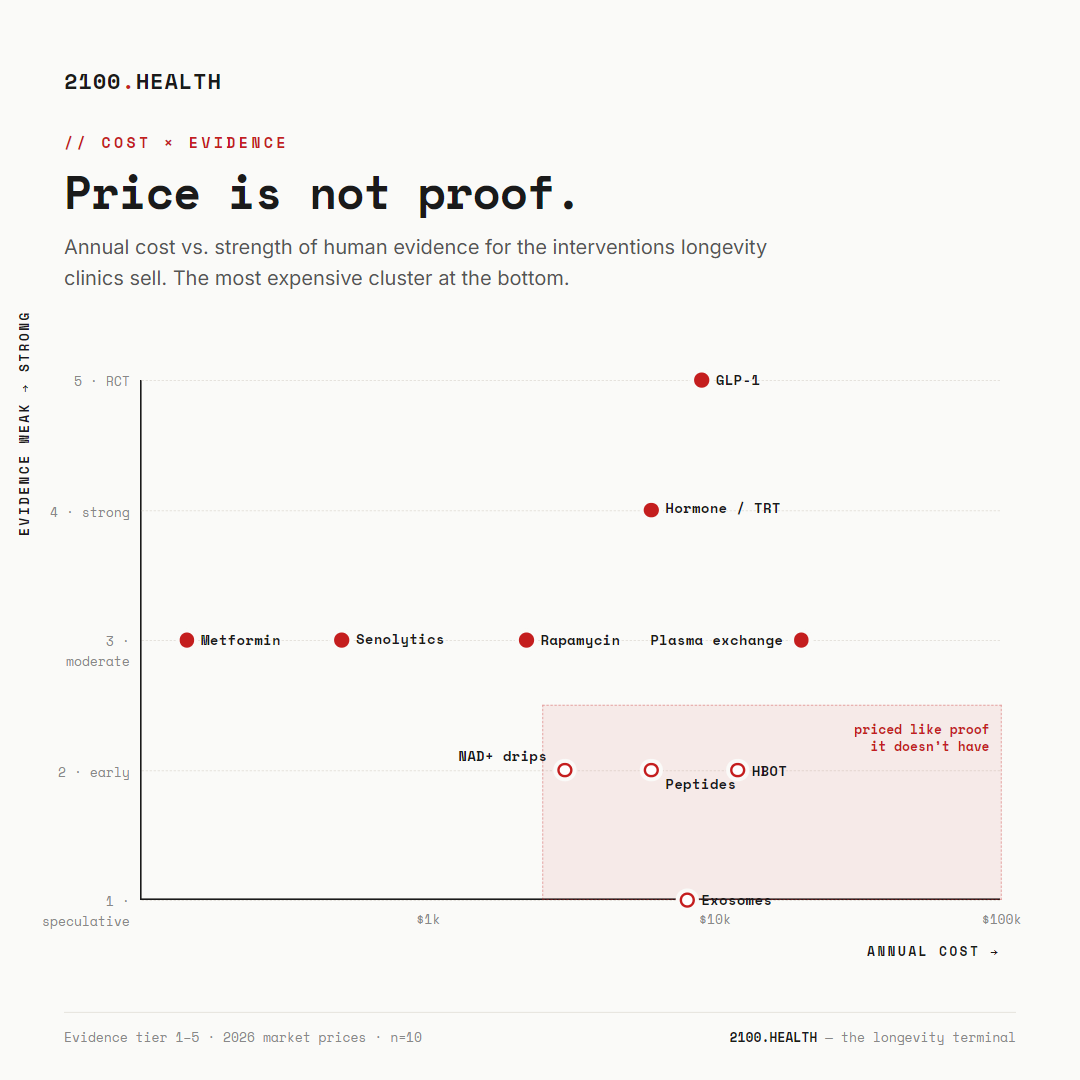
We priced every major longevity intervention and rated its human evidence on a 1–5 scale, then plotted one against the other. The two barely relate — and at the extremes they invert. The cheapest interventions tend to carry the strongest evidence; the most expensive, the weakest.
What the chart shows
- GLP-1 agonists — the strongest evidence on the board (cardiovascular events down 20% across 17,604 people), at a mid-range price.
- Metformin & rapamycin — among the cheapest interventions ($4–$77/mo), with solid evidence tiers.
- Exosomes — the lowest evidence tier we track, at $2,000–$18,000 a course. "Critical gaps in clinical data."
- NAD+ drips, peptides, HBOT — expensive and thinly evidenced. This is where the money leaks.
The takeaway: the price of a longevity intervention tells you almost nothing about how well it's proven. If anything, the correlation runs the wrong way.
See the live board — every clinic, price, and evidence rating.
Open the terminal Get matched →
Evidence tier 1–5 · 2026 market prices · Informational, not medical advice. Verify independently. — 2100.health